Excel in Qlik – Real-time data interaction
Work with
Qlik data, directly in Excel
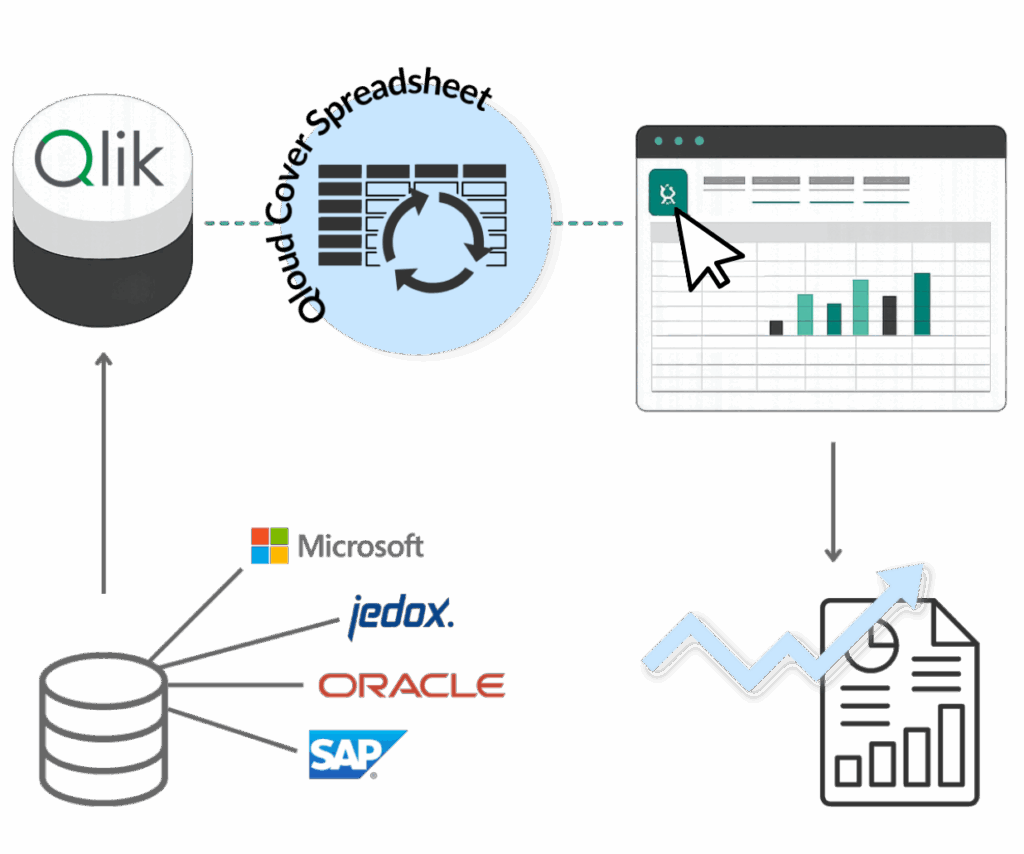
With Qloud Cover Spreadsheet, Qlik Cloud connects to Excel in real time, so you can explore, pivot, and report on live data, without scripts, plugins, or manual exports.
Update dashboards, use templates, or build dynamic PivotTables – all with fresh data, always in sync.
No delays, no data loss, just accurate insights exactly where you need them.
DEMO
Let's demonstrate Qloud Cover Spreadsheet for you
Watch our demo on how to dynamically connect and work with your Qlik data in Excel for better Finance Management, decision-making and using Qloud Cover Spreadsheet or Book a meeting with us for a personalized demo.
WHAT'S THE DEAL?
Bring Qlik Data to Life in Excel:
No Manual Exports Needed
Qloud Cover Spreadsheet makes it easy to work with Qlik data directly in Excel, in real-time and without extra steps.
Built for finance teams, analysts, and business users, it enables access to real-time measures, dimensions, and master items through Excel’s native cube structure.
There’s no need for plugins, exports, or custom scripts. Just open Excel and get to work — secure, instant and with full access to Qlik’s associative data model.
It’s the best of both platforms, brought together in one solution.

Pricing
Qloud Cover Spreadsheet operates with a pricing list based on your needs. The amount of apps and data you want to backup determines the predefined price. If you have questions or if your setup varies from the prices below, please contact us.
Are you ready to commit? Click to get in touch about your Qloud Cover Spreadsheet subscription.
Free
Features
-
Connections: 1
-
Users/connection: 1
-
Apps/connection: 2
-
Row limit: 10K
-
Service account only
-
Groups
-
Auto-sync
-
App permissions
-
Priority support
-
Audit logging
Starter
Features
-
Connections: 1
-
Users/connection: 3
-
Apps/connection: 5
-
Row limit: 25K
-
Individual user access
-
Groups
-
Auto-sync
-
App permissions
-
Priority support
-
Audit logging
Team
Features
-
Connections: 2
-
Users/connection: 15
-
Apps/connection: 15
-
Row limit: 50K
-
Individual user access
-
Groups
-
Auto-sync
-
App permissions
-
Priority support
-
Audit logging
Business
Features
-
Connections: 3
-
Users/connection: 50
-
Apps/connection: 30
-
Row limit: 100K
-
Individual user access
-
Groups
-
Auto-sync
-
App permissions
-
Priority support
-
Audit logging
Professional
Features
-
Connections: 5
-
Users/connection: 100
-
Apps/connection: 50
-
Row limit: 250K
-
Individual user access
-
Groups
-
Auto-sync
-
App permissions
-
Priority support
-
Audit logging
Enterprise
Features
-
Connections: Unlimited
-
Users/connection: Unlimited
-
Apps/connection: Unlimited
-
Row limit: Unlimited
-
Individual user access
-
Groups
-
Auto-sync
-
App permissions
-
Priority support
-
Audit logging
BREAKDOWN
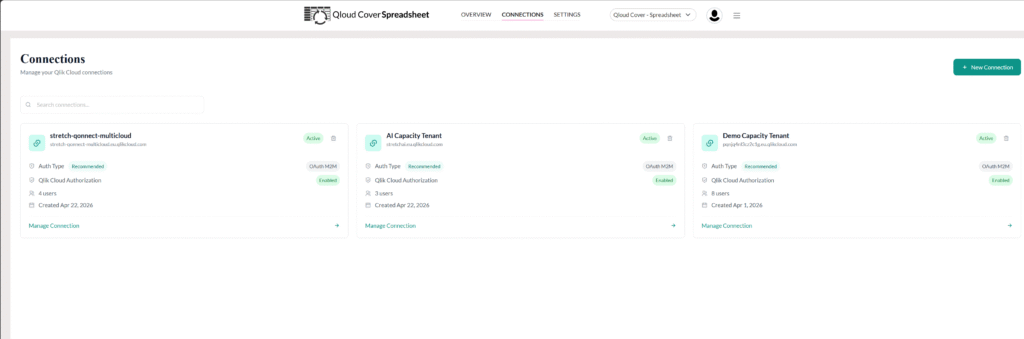
Functionalities
Direct Integration With Excel
Qloud Cover Spreadsheet integrates directly with Qlik via Excel’s built-in data sources folder. As a result, users can easily pull real-time data into Excel, without requiring desktop installations, third-party extensions, or additional software. In particular, this setup makes everything faster, cleaner, and more user-friendly.
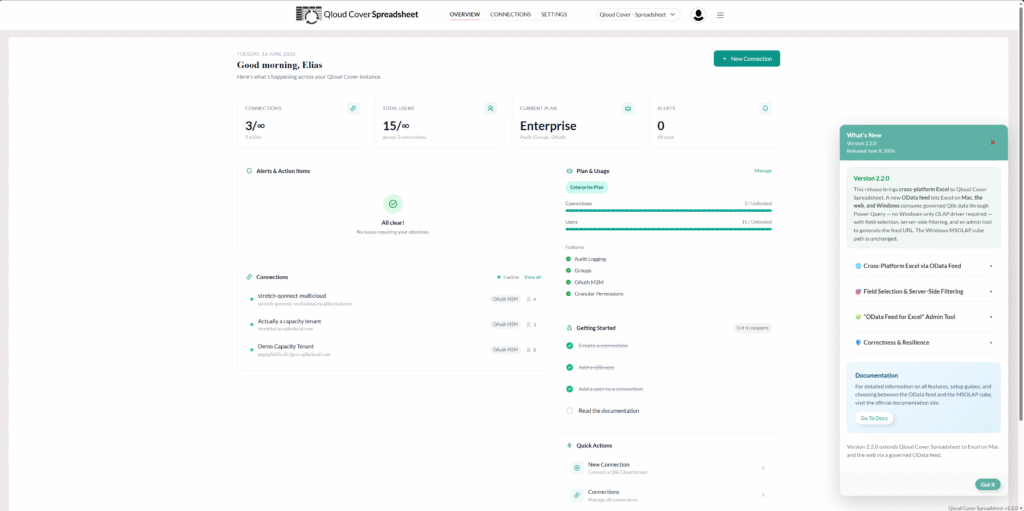
Live Data Streaming & Report Refresh
Rather than relying on static snapshots or outdated exports, Qloud Cover Spreadsheet continuously streams live Qlik data into Excel. This means your reports are always current, accurate, and ready for analysis.
Additionally, you can choose between two deployment models depending on your organizational needs:
SaaS (Cloud-based): Hosted on Azure, offering scalable, easy access with minimal setup and ongoing maintenance.
Client Managed: For full IT control and local hosting, ideal in secure or restricted environments.
Both options use secure, encrypted connections and support customer-controlled log storage, thereby enhancing compliance and data governance.
Flexible Deployment Options
Thanks to a bring-your-own-storage approach, customers always retain control over their backups. Qloud Cover Spreadsheet offers flexibility to match IT policies and operational preferences:
SaaS Deployment: Hosted in Microsoft Azure for rapid access, seamless integration, and encrypted security.
Client Managed Deployment: Suitable for air-gapped or highly regulated environments, enabling local installations, customization, and internal policy compliance.
In both models, you benefit from flexible deployment that matches your IT policies, while also ensuring no user data is stored within the service itself. In other words, you stay in full control.
Native Excel Experience
Finally, you can work with Qlik data inside Excel, just like you’re used to. No extra training, no compromises. Use:
PivotTables for structured, dynamic analysis
Excel formulas for deep insights
Charts and visualizations for impactful reporting
In short, you get advanced analytics capabilities although it doesn’t change how your team already works.


Why choose Qloud Cover Spreadsheet?
Excel continues to be the preferred tool for analysis and reporting in most organizations. However, traditional workflows often require manual exports, rely on static data snapshots, and suffer from disconnected processes. Qloud Cover Spreadsheet addresses these challenges by seamlessly delivering three key benefits:
Live Qlik data in Excel
Instead of relying on outdated snapshots, you can now create live, data-driven reports directly within Excel. This eliminates the need for manual updates and ensures your reporting stays current.
Native Excel experience
Moreover, it lets you work the way you already do. You can continue using familiar tools like PivotTables, formulas, and charts without needing to learn anything new or alter workflows.
100 % data security
Finally, by using Qlik data directly inside Excel’s formula engine, your organization retains complete data integrity and control. No third-party plugins or risky transfers. Just secure data handling.
EXPLAINER
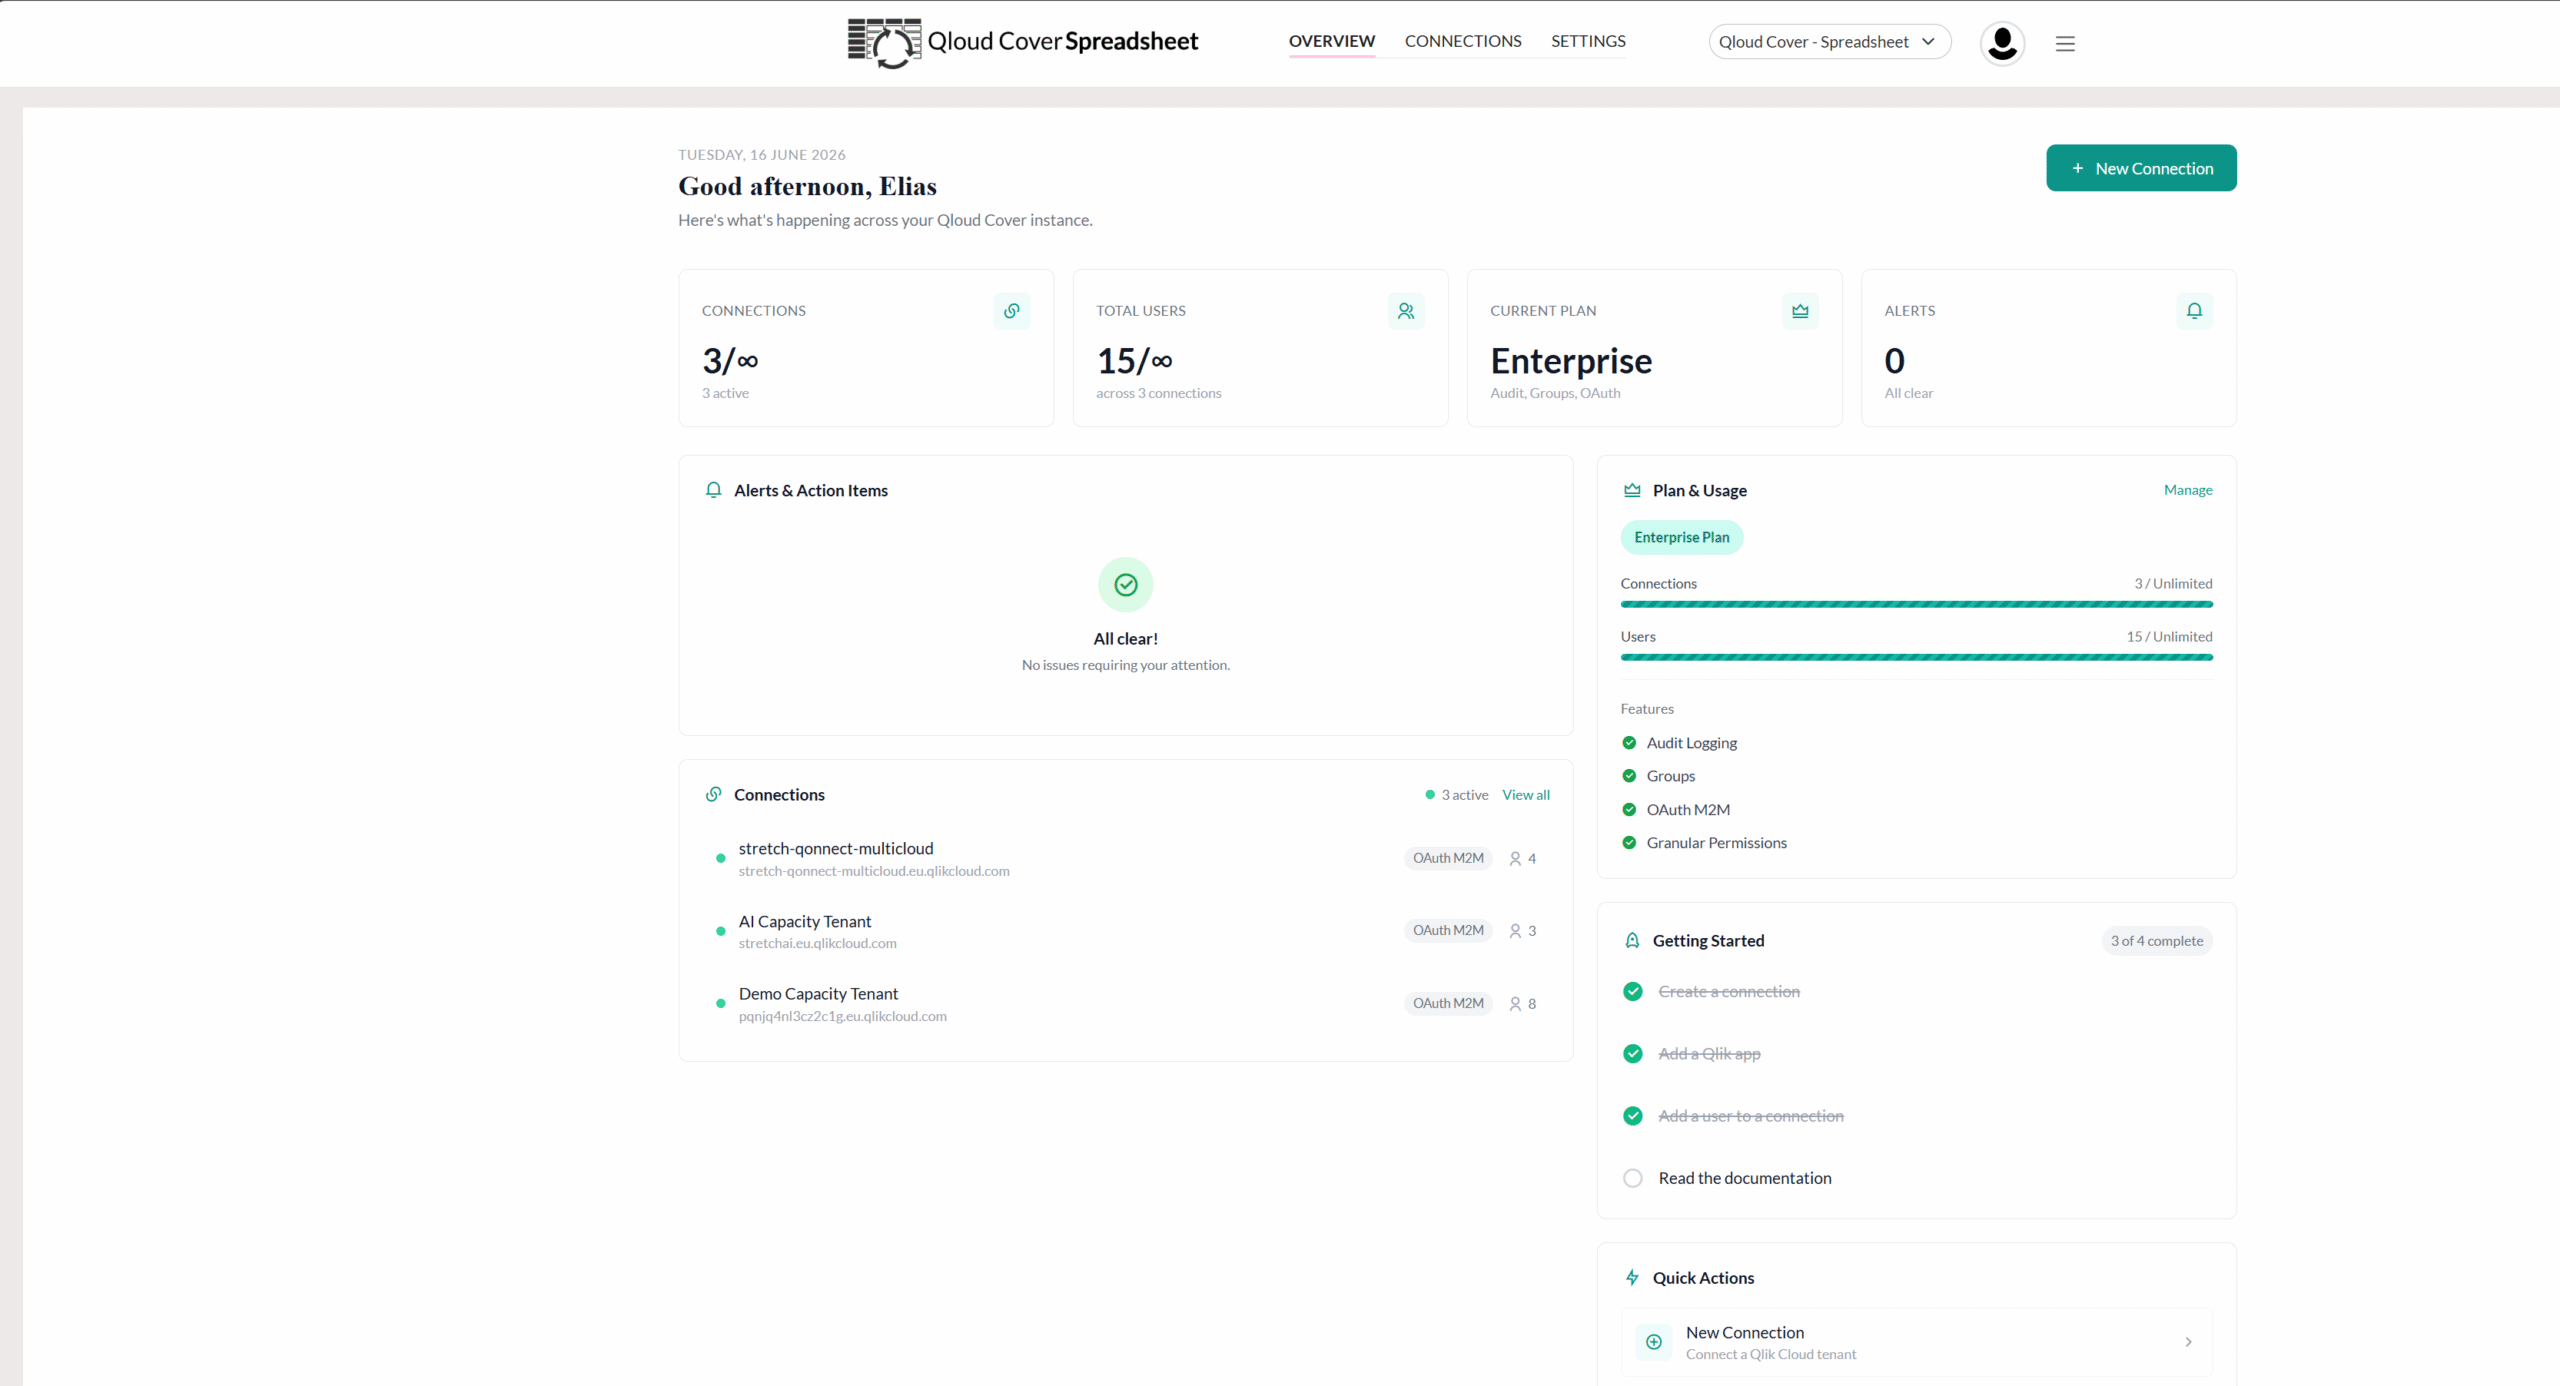
How does it work?
Qloud Cover Spreadsheet enables direct, secure access to governed and always up-to-date Qlik data in Microsoft Excel. This means you no longer need manual exports or external plugins. Instead, you can confidently work with live Qlik data, right inside Excel’s familiar interface.
1. SUBSCRIBE AND SET UP
First, purchase a license and configure access based on your specific Qlik data environment. After that, set up your connection. (You’ll find pricing and setup options detailed in the next section of this site.)
2. CONNECT FROM EXCEL
Next, open Excel and locate Qloud Cover Spreadsheet under Data Sources. Then, navigate through: Get Data → From Database → From Analysis Services. Enter your server name to establish a secure connection with your Qlik environment. Once the connection is active, you can browse and select the appropriate data models.
3. SELECT YOUR DATA
After establishing the connection, simply browse and select the exact data you need from Qlik’s associative model, this includes master measures, dimensions, and full data models. In doing so, only governed and relevant data is pulled in, enabling highly accurate reporting and analysis.
4. ANALYZE AND REPORT IN REAL-TIME
5. FLEXIBLE AND SCALABLE
Finally, ensure your reports always reflect the most current data. Thanks to Excel’s built-in refresh functionality, datasets are updated automatically, eliminating the need for manual steps. This helps you maintain integrity, consistency, and scalability across all your reports.
Installation guide & documentation
Please refer to the links below for all relevant documentation on using and getting started with Qloud Cover Writeback.
This information is especially beneficial if you have already gained access to the tool or are curious about the process and architecture behind it. It may also help you determine whether you need our support in these areas. If you have any questions or need further assistance, please don’t hesitate to contact us.
CONTACT
Want Excel and Qlik to finally speak the same language?
Do you want to know more about Qloud Cover Spreadsheet or try it before committing? Don’t hesitate to get in touch!